공부중
[SAR ADC] 논문 : Monotonic Capacitor Switching Procedure - 4. Measurement Results, 5. Conclusion 본문
[SAR ADC] 논문 : Monotonic Capacitor Switching Procedure - 4. Measurement Results, 5. Conclusion
복습 2024. 12. 4. 00:59A 10-bit 50-MS/s SAR ADC With a Monotonic Capacitor Switching Procedure
모노톤 커패시터 스위칭 절차를 적용한 10비트 50MS/s SAR ADC
이전 글 : https://brush-up.tistory.com/244
Measurement Results
The prototype was fabricated using a one-poly–eight-metal (1P8M) 0.13-μm CMOS technology. The full micrograph and the zoomed-in view of the core are shown in Fig. 13. The total area of the chip is 0.93 mm × 1.03 mm, with the ADC core taking up only 195 μm×265 μm. The switches for capacitors are placed close to the capacitor arrays. In this improved work, the logic control circuit has been optimized for power consumption and area, and the layout of the digital logic circuit is more compact. Therefore, the core area is smaller than that of the first prototype. An on-chip 100-Ω resistor is placed between the differential input ports to match the 50-Ω resistance of the signal cable. The measurement results of the prototype are presented below.
프로토타입은 원 폴리–팔 메탈(1P8M) 0.13-μm CMOS 기술을 사용하여 제작되었습니다. 전체 마이크로그래프와 코어의 확대된 뷰는 그림 13에 나타나 있습니다. 칩의 총 면적은 0.93 mm × 1.03 mm이며, ADC 코어는 오직 195 μm×265 μm만 차지합니다. 커패시터용 스위치는 커패시터 어레이에 가깝게 배치됩니다. 이 개선된 작업에서, 논리 제어 회로는 전력 소비와 면적에 대해 최적화되었고, 디지털 논리 회로의 레이아웃이 더욱 컴팩트합니다. 따라서 코어 면적은 첫 번째 프로토타입보다 작습니다. 칩 내부에는 100-Ω 저항기가 차동 입력 포트 사이에 배치되어 신호 케이블의 50-Ω 저항과 맞춰져 있습니다. 프로토타입의 측정 결과는 아래에 제시됩니다.

A. Static Performance
A. Static Performance
The measured differential nonlinearity (DNL) and integral nonlinearity (INL) of the proposed ADC are shown in Fig. 14. The peak DNL and INL are 0.91/−0.63 LSB and 1.27/−1.36 LSB, respectively. The figure shows that the INL has a jump at the middle of output codes. Since each test chip has this characteristic, the parasitic capacitance induced by the layout routing might be responsible for this inference. The MSB capacitance is around one LSB larger than the expected value. The performance of the ADC is mainly limited by this deterministic capacitor mismatch.
A. 정적 성능
제안된 ADC의 측정된 차동 비선형성(DNL)과 적분 비선형성(INL)은 그림 14에 나타나 있습니다. 최대 DNL과 INL은 각각 0.91/−0.63 LSB와 1.27/−1.36 LSB입니다. 그림에서는 INL이 출력 코드 중간에서 점프하는 것을 보여줍니다. 각 테스트 칩이 이 특성을 가지고 있기 때문에, 레이아웃 라우팅에 의해 유발된 기생 커패시턴스가 이 추론의 원인일 수 있습니다. MSB 커패시턴스는 예상값보다 약 한 LSB 더 큽니다. ADC의 성능은 주로 이 결정적인 커패시터 불일치에 의해 제한됩니다.

B. Dynamic Performance
B. Dynamic Performance
Fig. 15 shows the measured FFT spectrum with an input frequency of close to 10 MHz at a 1.2-V supply and a 50-MS/s sampling rate. The measured SNDR and SFDR are 56.5 dB and 64.6 dB, respectively.
B. 동적 성능 그림 15는 1.2-V 전원 공급과 50-MS/s 샘플링 속도에서 거의 10 MHz의 입력 주파수를 가진 측정된 FFT 스펙트럼을 보여줍니다. 측정된 신호 대 잡음 및 왜곡비(SNDR)와 주파수 왜곡비(SFDR)는 각각 56.5 dB와 64.6 dB입니다.

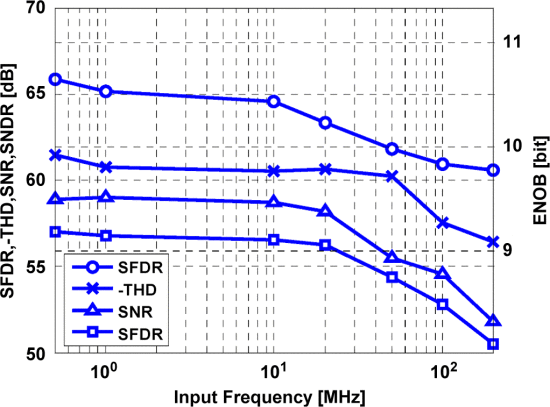
Fig. 16 plots the measured SNDR, SNR, SFDR, THD, and ENOB values versus the input frequency at 50 MS/s. At low input frequency, the measured SNDR and SFDR are 57.0 dB and 65.9 dB, respectively. The resultant ENOB is 9.18 bits. When the input frequency was increased to 50 MHz, the measured SNDR and SFDR were 54.4 dB and 61.8 dB, respectively. The effective resolution bandwidth (ERBW) is higher than 50 MHz.
그림 16은 50 MS/s에서 입력 주파수에 따른 측정된 SNDR, SNR, SFDR, THD, ENOB 값의 그래프를 나타냅니다. 낮은 입력 주파수에서 측정된 SNDR과 SFDR은 각각 57.0 dB와 65.9 dB입니다. 결과적인 ENOB는 9.18 비트입니다. 입력 주파수를 50 MHz로 증가시켰을 때, 측정된 SNDR과 SFDR은 각각 54.4 dB와 61.8 dB였습니다. 유효 해상도 대역폭(ERBW)은 50 MHz 이상입니다.

Fig. 17 shows the measured performance versus the sampling frequency with a 0.5-MHz sinusoidal stimulus. When the sampling rate was 60 MS/s, the ENOB was still close to 9 bits. Further increasing the sampling rate rapidly degraded the performance because the conversion time was insufficient.
그림 17은 0.5-MHz 사인파 자극과 함께 샘플링 주파수에 따른 측정된 성능을 보여줍니다. 샘플링 속도가 60 MS/s일 때, ENOB는 여전히 9 비트에 가깝습니다. 샘플링 속도를 더 높이면 변환 시간이 부족하여 성능이 급격히 저하됩니다.

C. Power Consumption
C. Power Consumption
At a 1.2-V supply, the analog part, including the S/H circuit and comparator, consumes 0.276 mW, and the digital control logic draws 0.42 mW. The ideal power consumption of the reference voltage Vref is

C. 전력 소비
1.2-V 공급 전압에서 아날로그 부분은 S/H 회로와 비교기를 포함하여 0.276 mW를 소비하고, 디지털 제어 논리는 0.42 mW를 소모합니다. 참조 전압 Vref의 이상적인 전력 소비는 다음과 같이 계산됩니다:

| 여기서 𝑓는 샘플링 빈도, 𝐶는 커패시턴스, 𝑉ref는 참조 전압, 그리고 𝑛은 비트 수입니다. 이 공식은 참조 전압의 전력 소비를 시간 단위로 나눈 평균 에너지 소비를 계산하여, ADC가 지속적으로 동작할 때 필요한 전력을 추정합니다. |
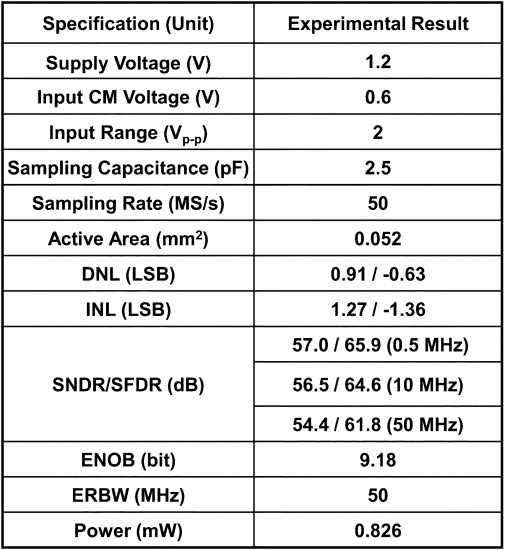
At a 1-V reference voltage, a 50-MS/s sampling rate, and a 4.8-fF unit capacitance, the expected power consumption is 0.062 mW. The measured value was 0.13 mW because the switch buffers consume dynamic current during transitions. The parasitic capacitors at the bottom plate and the drains of the switch MOS transistors also increase power consumption. Excluding the output buffers, the total power consumption of the active circuit is 0.826 mW. A summary of the ADC is listed in Table II.
1-V 참조 전압, 50-MS/s의 샘플링 속도 및 4.8-fF 단위 커패시턴스에서 예상되는 전력 소비는 0.062 mW입니다. 측정된 값은 0.13 mW였습니다. 이는 전환 중에 스위치 버퍼가 동적 전류를 소비하기 때문입니다. 스위치 MOS 트랜지스터의 하단 판과 드레인에 있는 기생 커패시터 또한 전력 소비를 증가시킵니다. 출력 버퍼를 제외하고, 활성 회로의 총 전력 소비는 0.826 mW입니다. ADC의 요약은 표 II에 나열되어 있습니다.

D. Low Supply Voltage Performance
D. Low Supply Voltage Performance
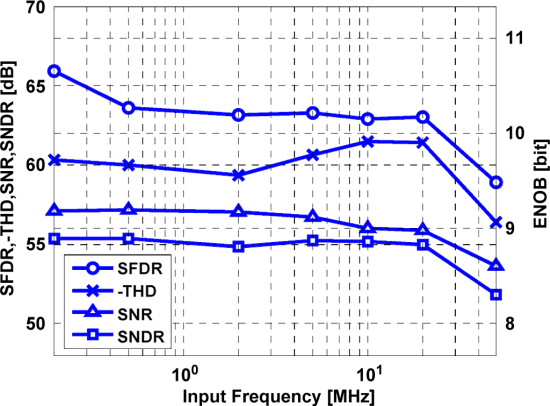
Because the ADC has no transmission gates or preamplifiers, it can operate at low supply voltage conditions. At 40 MS/s and a 1-V supply, the low frequency ENOB is 9.15 bits and the ERBW is around 50 MHz. At 20 MS/s and a 0.8-V supply, the low frequency ENOB is 9.19 bits and the ERBW is around 20 MHz. When the sampling rate and supply voltage were decreased to 10 MS/s and 0.6 V, respectively, the low frequency ENOB and ERBW were 8.91 bits and 20 MHz. Fig. 18 plots the performance versus input frequency at 0.6 V. Table III shows a performance summary for various supply voltages. The excellent low-voltage performance demonstrates that the proposed ADC is a feasible alternative to switched-operational-amplifier pipelined ADCs [16].
D. 저전압 공급 성능
ADC가 전송 게이트나 프리앰프가 없기 때문에, 낮은 전원 전압 조건에서도 작동할 수 있습니다. 40 MS/s와 1-V 공급에서, 저주파수 ENOB는 9.15 비트이고 ERBW는 약 50 MHz입니다. 20 MS/s와 0.8-V 공급에서, 저주파수 ENOB는 9.19 비트이고 ERBW는 약 20 MHz입니다. 샘플링 속도와 공급 전압이 각각 10 MS/s와 0.6 V로 감소했을 때, 저주파수 ENOB와 ERBW는 8.91 비트와 20 MHz였습니다. 그림 18은 0.6 V에서 입력 주파수에 따른 성능을 나타냅니다. 표 III은 다양한 공급 전압에 대한 성능 요약을 보여줍니다. 우수한 저전압 성능은 제안된 ADC가 스위치된 연산 증폭기 파이프라인 ADC[16]에 대한 실행 가능한 대안임을 보여줍니다.


E. Comparison and Discussion
E. Comparison and Discussion
To compare the proposed ADC to other works with different sampling rates and resolutions, the well-known figure-of-merit (FOM) equation is used.

E. 비교 및 토론 다양한 샘플링 속도와 해상도를 가진 다른 연구들과 제안된 ADC를 비교하기 위해 잘 알려진 성능 지표(Figure-of-Merit, FOM) 공식이 사용됩니다.

FOM은 일반적으로 ADC의 효율성을 평가하는 데 사용되며, 전력 소비, 해상도 및 샘플링 속도를 고려하여 계산됩니다. FOM 공식은 다음과 같이 주어집니다: 이 공식은 ADC가 소비하는 전력을 효율적으로 사용하여 얼마나 많은 정보를 처리할 수 있는지를 나타냅니다. ENOB (Effective Number of Bits)는 ADC의 성능을 나타내는 중요한 지표로, 실제로 유용한 비트 수를 의미합니다. 높은 ENOB와 낮은 전력 소비는 낮은 FOM 값을 의미하며, 이는 더 효율적인 ADC를 나타냅니다. 이 공식을 사용하여, 제안된 ADC를 다른 ADC들과 비교할 때, 낮은 전력 소비와 높은 ENOB 값이 어떻게 그 성능을 향상시키는지 평가할 수 있습니다. 이러한 비교를 통해 제안된 ADC의 경쟁력을 명확하게 파악하고, 특정 응용 프로그램 요구 사항에 맞는 최적의 선택을 제시할 수 있습니다. |
The FOM of the proposed ADC is 29 fJ/conversion-step at 50MS/s and a 1.2-V supply. The FOM is 9.6 fJ/conversion-step when the sampling rate and supply voltage are 10 MS/s and 0.6 V, respectively. Table IV compares the proposed ADC with other state-of-the-art ADCs [11], [12], [17]–[19]. Although the proposed ADC was fabricated using older technology, it still has the lowest FOM and smallest active area compared to those of ADCs with similar sampling rates and resolutions.
제안된 ADC의 성능 지표(FOM)는 50MS/s 및 1.2-V 전원에서 변환 단계당 29 fJ입니다. 샘플링 속도와 공급 전압이 각각 10 MS/s 및 0.6 V일 때, FOM은 변환 단계당 9.6 fJ입니다. 표 IV는 제안된 ADC를 다른 최신 ADC들[11], [12], [17]–[19]과 비교합니다. 제안된 ADC는 더 오래된 기술을 사용하여 제작되었음에도 불구하고, 유사한 샘플링 속도와 해상도를 가진 다른 ADC들에 비해 가장 낮은 FOM과 가장 작은 활성 면적을 가지고 있습니다.

Conclusion
In this paper, an efficient capacitor switching procedure for SAR ADCs was presented. The proposed switching procedure leads to both lower switching energy and smaller total capacitance. It also simplifies the digital logic control circuit. The biased comparator reduces the dynamic offset induced by input common-mode voltage variation. The prototype achieves a 50-MS/s operation speed with power consumption of less than 1 mW. It has a FOM of 29 fJ/conversion-step and occupies an active area of only 0.052 mm2. The experiment results demonstrate the power and hardware efficiency and also the high-speed potential of the proposed SAR ADC.
이 논문에서는 SAR ADC를 위한 효율적인 커패시터 전환 절차를 제시했습니다. 제안된 전환 절차는 전환 에너지를 낮추고 총 커패시턴스를 줄입니다. 또한 디지털 논리 제어 회로를 단순화합니다. 편향된 비교기는 입력 공통 모드 전압 변동에 의해 유발되는 동적 오프셋을 줄입니다. 프로토타입은 1mW 미만의 전력 소비로 50 MS/s의 작동 속도를 달성합니다. 이는 변환 단계당 29 fJ의 FOM을 가지며, 활성 면적은 단지 0.052 mm^2입니다. 실험 결과는 제안된 SAR ADC의 전력 및 하드웨어 효율성과 높은 속도 잠재력을 입증합니다.
논문 링크 : https://ieeexplore.ieee.org/document/5437496
A 10-bit 50-MS/s SAR ADC With a Monotonic Capacitor Switching Procedure
ieeexplore.ieee.org
'시스템 반도체 설계 > SAR ADC' 카테고리의 다른 글
| [SAR ADC] 논문 : Monotonic Capacitor Switching Procedure - 3. Implementation of Key Building Blocks (0) | 2024.12.03 |
|---|---|
| [SAR ADC] 논문 : Monotonic Capacitor Switching Procedure - 2. ADC Architecture (0) | 2024.12.02 |
| [SAR ADC] 논문 : Monotonic Capacitor Switching Procedure - 1. INTRODUCTION (0) | 2024.12.01 |
| [SAR ADC] SAR ADC (2) 노이즈 발생 원인 (0) | 2024.05.31 |
| [SAR ADC] SAR ADC (1) 동작 구조 (0) | 2024.05.31 |


